Case study
The chart caught it before the owner did — a StayServ case study
A property owner logged into his StayServ dashboard and spotted two things in one chart that outed a management problem — the backlog line curving up, and the new-ticket bars collapsing at the same time. Here's what the chart made visible, and what he found when he pulled the thread.
Details in this case study have been anonymized at the operator's request. The property, numbers, and situation are real; identifying details (property name, staff names, exact size) are not. The situation is ongoing — the owner has not landed on a final fix yet. We're publishing the catch, not the resolution.
Most of the case studies you read in this category end with a tidy graph going up and to the right. This one doesn't. What it has instead is something I think is more useful: an honest look at what a single dashboard chart made visible about a property where the reporting loop had quietly collapsed — and how far the owner was from knowing it before he opened the tab.
What he saw
The owner runs a mid-size property in Nova Scotia, in the 170-room range. He'd been on StayServ for about a year. He doesn't log into the dashboard every day — his GM does the day-to-day, he checks in weekly, mostly on the money side.
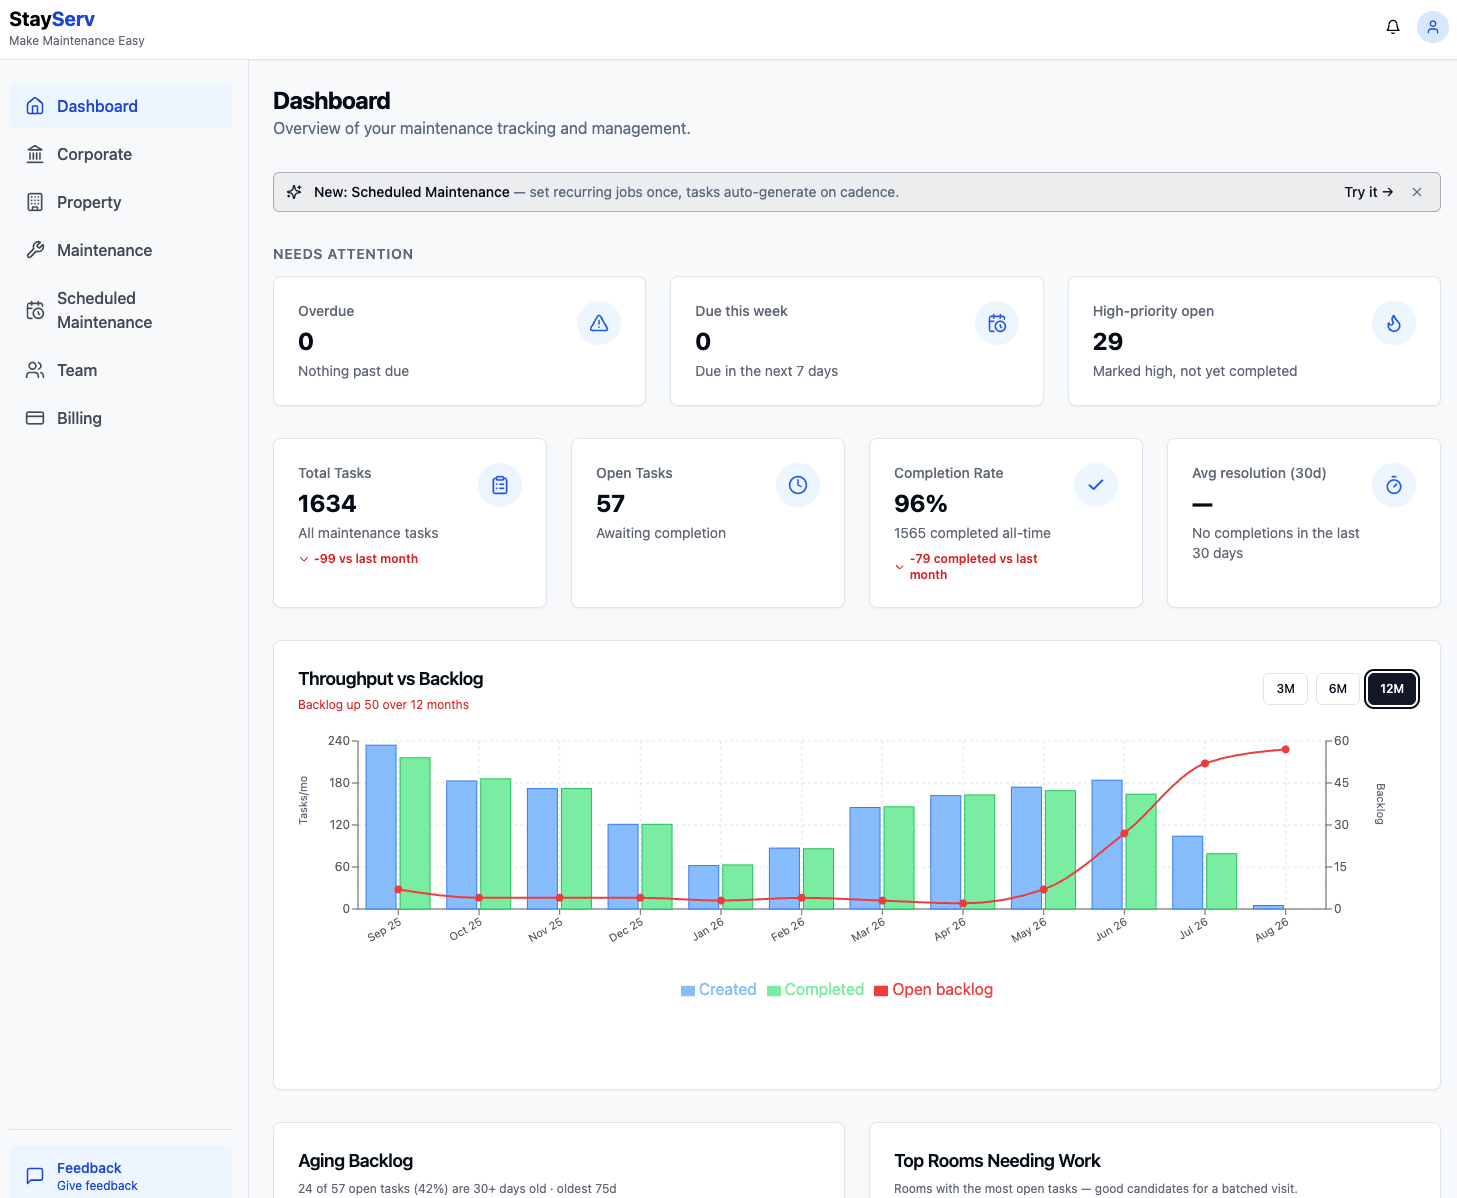
Last Tuesday morning he opened the Dashboard tab and this is what was on screen:
- 1,634 total tasks all-time
- 57 open right now
- 96% all-time completion rate
- 29 high-priority items still open
- 0 overdue, 0 due this week
- Avg resolution (30d): — · No completions in the last 30 days
- Aging backlog: 24 of 57 open tasks (42%) are 30+ days old · oldest 75 days
- Throughput vs Backlog (12M): Backlog up 50 over 12 months
Read the top row and you'd say the property looks fine. 96% completion. Zero overdue. High-priority number is elevated but not on fire.
Then he looked at the chart underneath, and the story completely changed.
The chart, in plain English
The throughput-vs-backlog chart puts three numbers on the same time axis, one bar and one line per month:
- Blue bar — tasks created that month (how much work came in the door)
- Green bar — tasks completed that month (how much work went out the door)
- Red line — open backlog at month-end (what's carried into next month)
When a property is healthy, blue and green are roughly the same height month after month, and the red line runs flat along the bottom. Work comes in, work goes out, nothing piles up.
Look at the chart above. From September through April, blue and green bars are near-identical heights and the red line hugs the bottom of the chart — eight months of a property running normally. Then something starts to slip in May. June is clearly wrong. July is worse. August looks like the property closed.
August didn't look like August because the property closed. It looked like August because nobody was using the system anymore.
Two signals in one chart
When the owner sent me a screenshot, the first thing I did was point out what he'd already half-clocked: this isn't one problem, it's two, and they mean different things.
Signal 1 — the red line curving up (May → present)
Starting in May, the backlog line lifts off the floor and doesn't come back down. That's the "created > completed" gap accumulating month over month.
What that means in plain English: tickets are being opened faster than they're being closed. The maintenance side of the operation has stopped keeping up.
By itself this could be a lot of things — a tech quit, an equipment failure ate a month of hours, the hotel preventive maintenance program caught up all at once. It's a signal, not yet a diagnosis.
Signal 2 — the blue bars collapsing (Jul → Aug)
This is the one the top-line stats hide entirely. The blue bar in August is almost invisible. Five-ish new tickets in an entire month, on a 170-room property that was averaging ~160/month all spring.
What that means in plain English: nobody is reporting anything anymore. Guests are still checking in. Faucets are still dripping, lights are still burning out, HVAC set points are still drifting. On a 170-room property, five tickets in a month isn't a slow month — it's a stopped process. Those tickets aren't getting written down.
That is not a maintenance-side problem. Maintenance can only close tickets that get opened. Ticket creation is a front-desk-and-housekeeping-and-GM behavior — it's the reporting culture of the property, and in August that culture was gone.
Why both together tells you it's management, not staff
If it were just Signal 1, you'd look at the maintenance tech or the workload.
If it were just Signal 2, you'd look at whether the front desk got confused about how to file a ticket, or whether a shift change broke the habit.
Both at once, in the same two months, is different. It says the person whose job it is to notice both of those things — and to nag the front desk to keep filing, and to hold the maintenance side to closing — has stopped noticing.
That person is not a housekeeper or a tech. That's the manager.
When I said that back to the owner, his reply was one line: "Yeah — there's been an ongoing issue with the management there. This confirms it."
He'd suspected it for a while. What he didn't have, before opening the chart, was proof he could point at.
What the top-line numbers were hiding
Circle back to the four cards at the top of the dashboard. This is why the chart matters more than the summary tiles:
"96% completion rate." True — over 1,634 all-time tasks. But it's an all-time average, and 1,565 of those completions happened in the healthy months. A rate calculated over a year of history takes a long time to move; two bad months barely dent it.
"0 overdue, 0 due this week." True — because a ticket only becomes overdue if someone set a due date on it, and if tickets are being aged without being touched, or if new tickets aren't being filed at all, there's nothing to be due. Zero overdue is not the same as zero problems. It can mean nobody's driving.
"29 high-priority open." This one was closest to honest, and he had noticed it. But 29 sounds like a workload number, not a crisis. In isolation it doesn't say "the reporting loop is broken."
"Avg resolution (30d): —" This one, in hindsight, was screaming. A dash where a number should be, with the subtitle "No completions in the last 30 days." A property that closed zero tickets in 30 days is either shut down or not being run. He'd skimmed past it because everything else on the row looked green.
The chart said the same thing the "—" said, but in a shape a human eye can't skim past.
What he did next (and what he hasn't done yet)
I want to be honest that this case study is being published mid-story, not after.
Here's what the owner has done so far:
- Opened the actual task list, filtered to open + aged 30+ days, and read the titles. His words: several of them were things he would've expected to be handled the same week.
- Checked who was on the assignee field for the aging tickets. Not going to publish specifics, but the pattern was concentrated, not spread.
- Called the front desk lead directly, not the GM, and asked what the ticket-filing routine had looked like the last two months. What came back was: it had drifted.
- Confirmed to me over text that this matched a management concern he'd been sitting on for weeks.
Here's what he has not done yet:
- Talked to the manager. That conversation is this week.
- Decided whether it's a coaching problem, a staffing problem, or a role-change problem.
- Rebuilt the reporting habit at the front desk. (When he does, the step-by-step of how a ticket gets filed in StayServ is what we'll re-share with the desk team.)
I don't know how it's going to land. Neither does he. When we know, we'll update this post — with his permission — with what actually worked. If it doesn't work, we'll say that too.
The generalizable version
Strip the specifics off and this is a pattern I've now seen at several StayServ properties, and it's worth naming for anyone reading this on their own dashboard.
A rising backlog line by itself is a workload signal. It might mean you need to hire, reassign, or push out a PM cycle. Look at the maintenance side.
A falling created-bar by itself is a reporting signal. It usually means a shift change, an onboarding gap, or someone at the front desk who wasn't taught how to file a ticket.
Both moving in opposite directions at the same time is a management signal. The person whose job it is to notice both sides of the loop isn't noticing. That is almost never a tools problem, and it is almost never solved by adding a report or a Slack channel — or, for that matter, by switching hotel maintenance software. It's a conversation.
The chart's job is to make the pattern visible early enough that the conversation happens while it's still a two-month drift and not a two-quarter one. It did that here. The owner is now three months into visibility, not nine.
What to check on your own dashboard, right now
If you're a property owner reading this and you haven't looked at the throughput-vs-backlog chart in a while:
- Set the range to 12M. 3M and 6M will hide slow drift. You want to see whether the current shape is a regression from a healthy baseline, and you need the baseline in frame to know.
- Look at the red line, not the tiles. If it's flat along the bottom, you're healthy on the maintenance side regardless of what the tiles say. If it's curving up over the last 60–90 days, that's Signal 1.
- Look at the blue bars for the last two months against the eight before them. A blue bar that's 20% or less of the trailing average is Signal 2. If the property is genuinely quieter (off-season, renovation, closed floor), that's fine — you'll know. If it's not, someone stopped filing.
- Read the "Avg resolution (30d)" tile literally. A dash isn't a null. It's a claim that zero tickets closed in a month, and that claim is almost always wrong about the property and right about the process.
- If both signals are lit, don't start with the tech. Start with the manager. That's the conversation the chart is asking you to have.
That's it. That's the whole read.
Related reading
- Hotel Maintenance Checklist Template 2026 (Free Excel + PDF) — if the fix at your property involves rebuilding the reporting cadence from scratch, start here. Daily / weekly / monthly / quarterly, printable or digital.
- The best hotel maintenance software of 2026 — the honest, segment-by-segment buyer's guide. Includes StayServ but explicitly flags where competitors (hotelkit, Flexkeeping, Breezeway, MaintainX) win.
- How to use StayServ maintenance — the end-to-end product walkthrough. Useful to re-share with a front-desk team that has drifted on ticket filing.
If you want to see the chart on your own property, it's on the Dashboard tab of any StayServ account — including the forever-free 1-room plan. If you're not on StayServ and you want to see what the chart looks like against real data before you commit anything, the free interactive demo has it loaded with a sample property.